Jesse Margolis and Eli Groves
June 2019
Background
Over the past two decades, since its school district was taken over by the state of New Jersey, the city of Newark has undertaken numerous large-scale reforms in public education, including charter school expansion, closure or replacement of underperforming schools, curriculum redesign, and negotiation of a new teachers contract. Additionally, the city’s school district and charter sector worked together to develop a universal enrollment system, where families can submit a single application for almost any school in the city. In February 2018, based on improved results and a collaborative agreement between Newark’s mayor and the state-appointed superintendent, New Jersey returned control of Newark’s district schools to the city. Therefore, the 2017-18 school year serves as a reasonable end-point to the period of state-control. The purpose of this report is to evaluate Newark student performance through this end-point, and in doing so, provide a baseline against which to measure Newark’s future progress under local control.
Findings
This study finds that Newark’s citywide test score performance, test score growth, and graduation rate have all increased during the period under study, with gains coming from both the city’s charter sector and traditional public schools.
Key Findings Include:
- Between 2006 and 2018, when compared to other low-income cities and towns in New Jersey, Newark’s citywide average test score rank has improved from the 39th to the 78th percentile in both ELA and math.
- The share of Black students in Newark attending a school that beat the state state proficiency average in their grade has more than quadrupled, from 7% in 2006 to 31% in 2018.
- New Jersey sets a high bar, as low-income students in New Jersey (including those in Newark) earned a higher proficiency rate in Math and ELA than their counterparts in every other PARCC state in 2018.
- Newark’s charters have shown particularly strong test score gains, and in 2018, they beat the state proficiency rate for the first time in both math and ELA.
- In high school, the citywide four-year graduation rate has risen from 63% in 2011 to 77% in 2018 and closed the gap with the state by seven percentage points.
- K-12 enrollment has stabilized in district schools while continuing to grow in charters, and citywide enrollment in 2018 topped 50,000 for the first time in at least two decades.
- However, there remains much work to be done:
- When compared to all cities and towns in New Jersey – not just those with similar populations – Newark’s citywide average test score rank is in the 14th percentile (though up from the 4th percentile in 2006).
- Over 15,000 children in Newark – roughly 30% the city’s students – attend low growth, low proficiency schools.
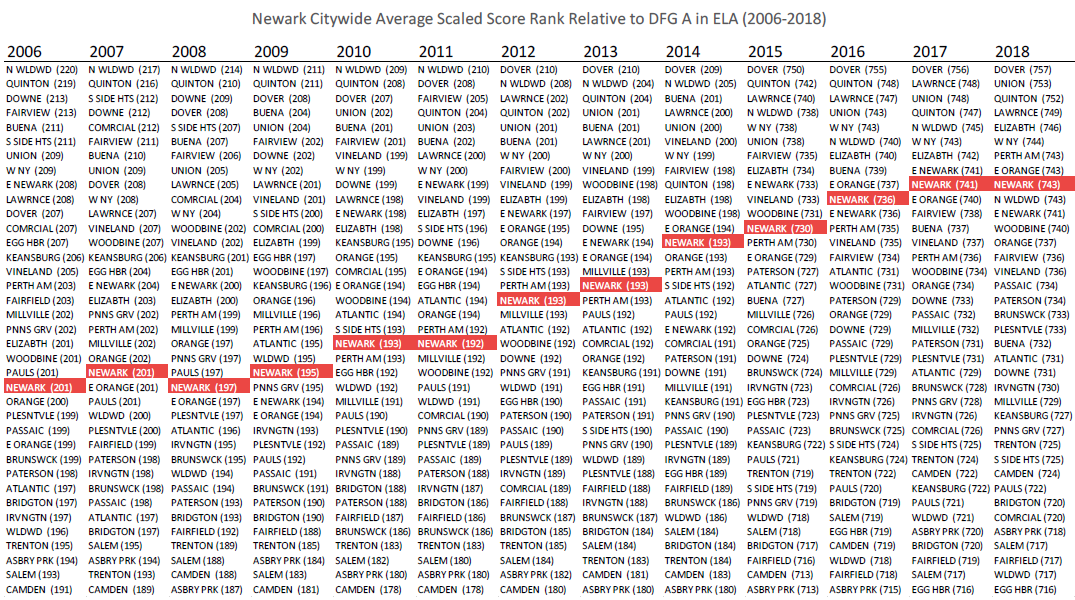
Figure – When compared to low-income cities and towns in New Jersey, Newark’s citywide test score rank has improved from 2006 to 2018

Each column in the figure shows the 37 cities or towns in New Jersey’s District Factor Group A (DFG A) ranked based on their grade 3-8 average scaled score in ELA from 2006-2018. District Factor Groups are groups of cities or towns that the state has determined are demographically similar and represent an approximate measure of a community’s relative socioeconomic status. Newark is in DFG A, which comprises cities or towns with the highest-need populations in New Jersey. As shown in the figure, Newark’s citywide ranking – including both district and charter schools – was 23rd of 37 DFG A cities and towns in 2006 (39th percentile) and rose to 9th of 37 cities and towns in 2018 (78th percentile).
Media Coverage
The 74 (June 13, 2019) – During Booker Era, Study Shows Newark Schools Took Huge Steps Forward – and It’s Not Just Charters That Improved
TapInto (June 13, 2019) – Newark Schools Show Dramatic Improvement During Past Decade
Chalkbeat (June 14, 2019) – Superintendent León unveils long-awaited plan to build ‘stronger, wiser’ school system
Politico (June 14, 2019) – Morning Education: Report Roundup
The 74 (June 18, 2019) – Waters: Where Have You Gone, Cory Booker?
Chalkbeat (June 18, 2019) – Newark schools – traditional and charter – have made big gains since 2006, new report shows
Newark Star-Ledger (June 24, 2019) – Newark’s schools have clearly improved, researcher says. But why?
TapInto (June 25, 2019) – Newark Public School Enrollment Continues to Grow
The 74 (November 18, 2019) – Cory Booker and Charter Schools: Before the New York Times Essay, What the Senator Has Said – and What Research Has Shown – About His Education Track Record in Newark
Newark Star-Ledger (November 25, 2019) – After a decade of success, agency that helped charter schools grow in Newark will close | Opinion
The 74 (December 11, 2019) – 14 Charts that Changed the Way We Looked at America’s Schools in 2019
