Jesse Margolis, October 2017
Background
Newark’s public schools entered the national spotlight in 2010 when it was announced that $200 million in private philanthropy would be donated to the school district. This gift supported numerous significant reforms in the city’s public schools, and these reforms generated substantial upheaval, as has been well documented elsewhere. Less well documented is the progress the city’s public schools have made over the past seven years. The study seeks to fill that gap, taking multiple approaches to analyzing progress in Newark using student test scores at the elementary and middle school level, the graduation rate at the high school level, and student enrollment at all levels. Where possible, this study also replicates earlier work by other researchers, updating their analysis with the most recent data available.
Findings
- Total public-school enrollment in Newark has increased over time, and is higher than at any point in recent history.
- In grades 3-8, Newark schools made significant strides in closing the achievement gap with the state and improved relative to similar high-need districts.
- Since 2012, Newark students’ growth has improved compared to students statewide with similar starting achievement levels.
- The high school graduation rate has increased dramatically from 2011 to 2017, improving at a faster rate than in the rest of the state.
- Replicating and extending other researchers’ analyses with more recent data produces similar evidence of growth Newark’s schools, specifically:
- Black students in Newark are three times more likely to attend a school with test scores above the state average today than they were in 2009.
- Controlling for poverty and ELL status, Newark students show significant gains in math and ELA scores between 2009 and 2017.
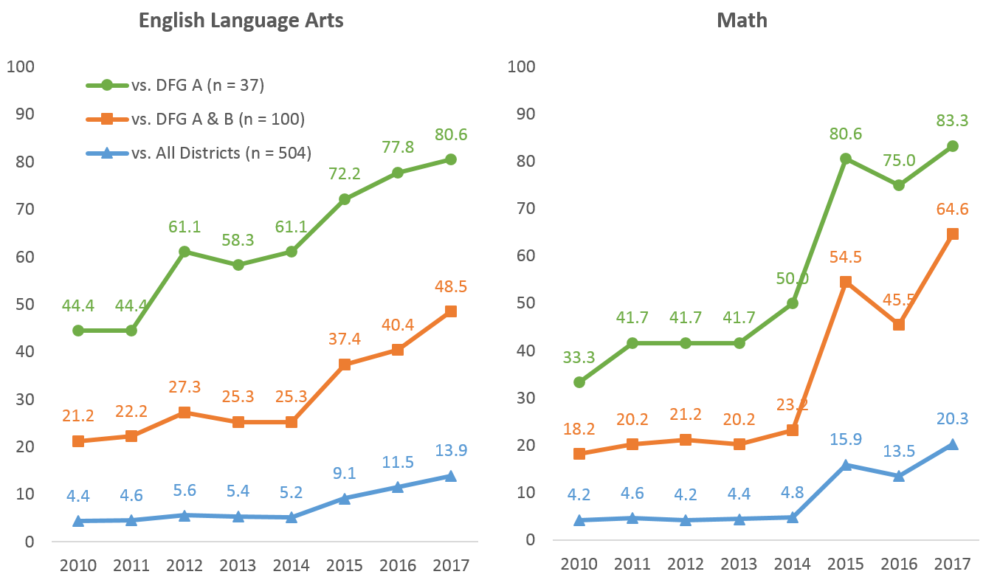
Figure – Percentile Rank for the City of Newark (Grade 3-8 Test Scores)

The chart above shows Newark’s percentile rank – based on grade 3-8 proficiency on state tests – against the comparison groups noted. DFG A stands for District Factor Group A and represents those school districts that the State of New Jersey has determined serve the highest need communities. In both subjects, Newark’s rank has improved against all comparison groups, particularly since 2014. These graphs include both district and charter schools. The full report contains a similar analysis for NPS only.
Media Coverage
TapInto Newark (October 16, 2017) – Harvard, MarGrady studies reveal overall gains for Newark’s public schools
Chalkbeat (October 16, 2017) – The $100 million question: Did Newark’s school reforms work? New study finds big declines, then progress
USA Today (October 16, 2017) – What did Zuckerberg’s $100 million buy in Newark? A bit of progress
The New Yorker (September 10, 2018) – Can Mark Zuckerberg fix Facebook before it breaks democracy?