Jesse Margolis, Daniel Dench, and Shirin Hashim
July 2020
Background
New York State has one of the most diverse and segregated school systems in the country. The state is diverse because its students hail from a wide variety of racial, ethnic, and economic backgrounds. It is segregated because students of different backgrounds generally attend different schools. The state’s diversity, however, gives it the potential to integrate its schools. This is particularly true when students of different backgrounds live relatively close to one another, as is frequently the case in the state’s largest municipality: New York City.
To address segregation, both the state, the city, and local school districts have developed a number of integration plans over the past few years. Among the earliest were middle school integration plans in two of the most segregated community school districts in New York City: District 3 in Manhattan and District 15 in Brooklyn. Both school districts adopted controlled choice programs to prioritize economically disadvantaged students for admission into sixth grade in 2019-20. However, the results of these two initiatives varied dramatically. In this study, we evaluate the impact of both integration efforts on segregation and seek to explain their divergent results.
Key Findings:
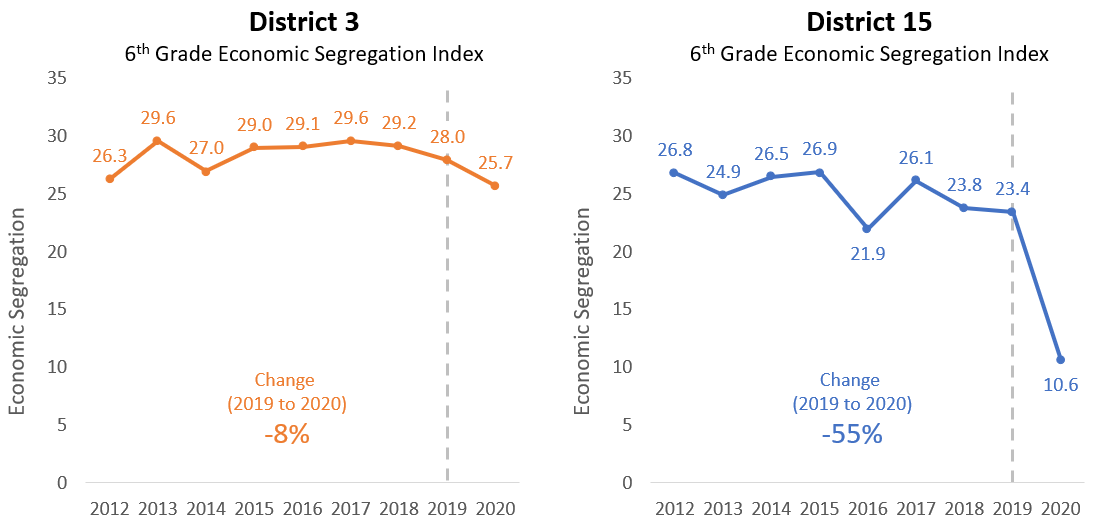
- In District 15, economic segregation in sixth grade decreased by 55% and racial segregation decreased by 38%; these results are both large and statistically significant, and are robust to various alternative specifications
- In District 3, economic segregation in sixth grade decreased by 8% and racial segregation decreased by 5%; these changes are not statistically significant and are within the bounds of normal year-to-year fluctuations
- While the broad contours of the districts’ plans were similar, two key differences appear likely to explain the divergent results. First, District 15 dropped academic screens from all middle schools, while District 3 retained them. Second, District 15 set more aggressive targets, prioritizing economically disadvantaged students for 52% of sixth grade seats, compared to 25% in District 3
Figure – In 2019-20, sixth grade economic segregation declined by 8% in District 3 and by 55% in District 15.

Source: Analysis of NYSED enrollment data. Note: the segregation index shows the average percentage point difference between the share economically disadvantaged at each school and the share economically disadvantaged in the district, weighted by school enrollment. Years use an end-of-year convention, so 2020 represents the 2019-20 school year.
Integration Dashboards at IntegrateNY.org
To support districts in monitoring segregation and developing plans to promote integration, MarGrady Research, along with the New York State Education Department and the Center for Public Research and Leadership at Columbia University, has developed dashboards to visually display enrollment, demographic, and segregation data for the state’s 724 school districts and 62 counties.
Media Coverage
Chalkbeat New York (November 14, 2022) – A Brooklyn middle school integration plan shows some patterns are hard to break
Peer-Reviewed Research
Margolis, J., Dench, D., & Hashim, S. (2023). Economic and Racial Integration Through School Choice in New York City. Educational Evaluation and Policy Analysis, 45(1), 182-190.
